Faculty, Students

A new curriculum module allows students to analyze and explore climate change data in real time.

Last summer, two Puget Sound faculty members received some exciting news. They’d won a National Science Foundation grant to develop new course modules that would allow students to explore and experience real data collected by Arctic and Antarctic scientists.

The potential for increased climate literacy and critical thinking was huge. Steven Neshyba, professor of chemistry, and Lea Fortmann, assistant professor of economics, believe that the most effective way to teach students about climate change is to let them engage with real polar research such as data on snowpack cover, glacier melt rates, and the maps and models associated with them. This information is uploaded by scientists working out of research stations like McMurdo on the Antarctic coast or the Barrow Observatory in the Arctic, and students can access it from a variety of sources, including the National Snow and Ice Data Center.

The way that students explore this research is through computational guided inquiry (CGI). In a CGI-structured course, the instructor guides the students in scientific inquiry using computational tools for managing, analyzing, and visualizing data. “CGI is a process, not a result,” Steven says. “Each CGI module is different, but the aim is for students to work through problems, not just solve them. It opens the door to scientific thinking.”

For example, a Polar CGI module might show a student how to create a probability distribution of the surface temperature at a meteorology station in Barrow, Alaska, and then invite the student to do something similar with data from a different part of the world.

“There are two goals with this project: The first is to increase climate literacy and knowledge of polar information. The second is to enable students to critically analyze data,” Lea explains.

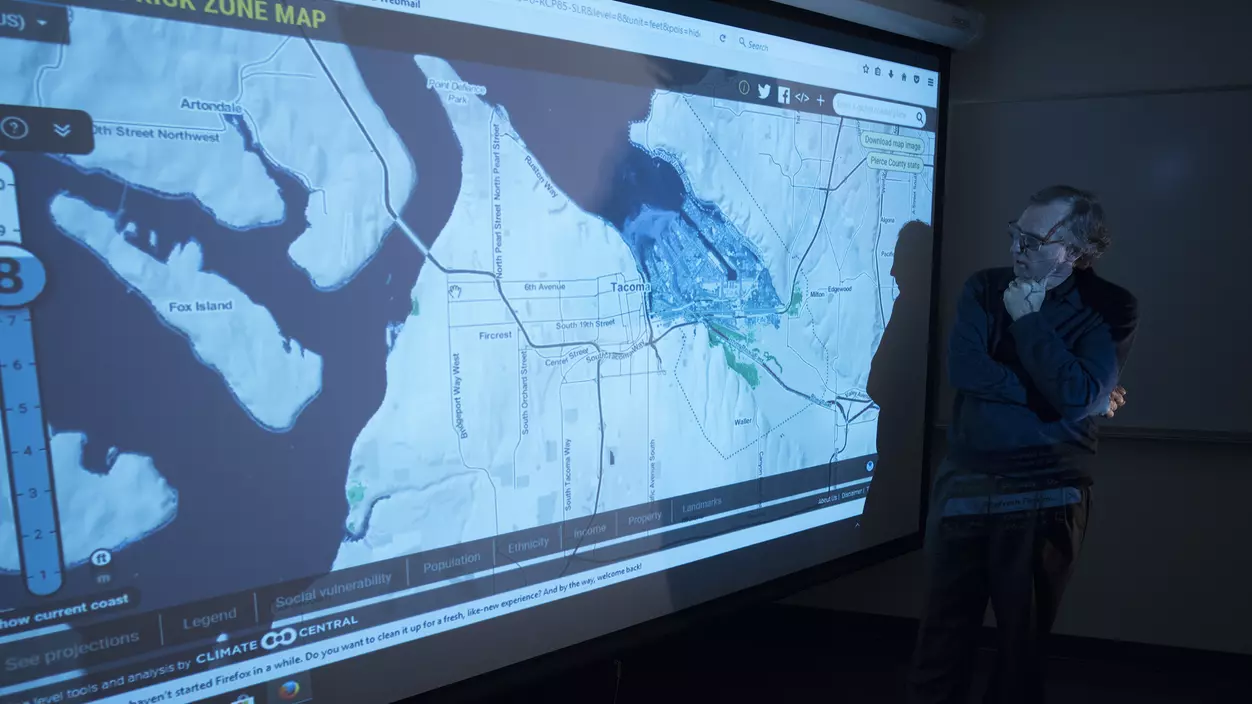
A person looking at a map of Tacoma projected on a large screen
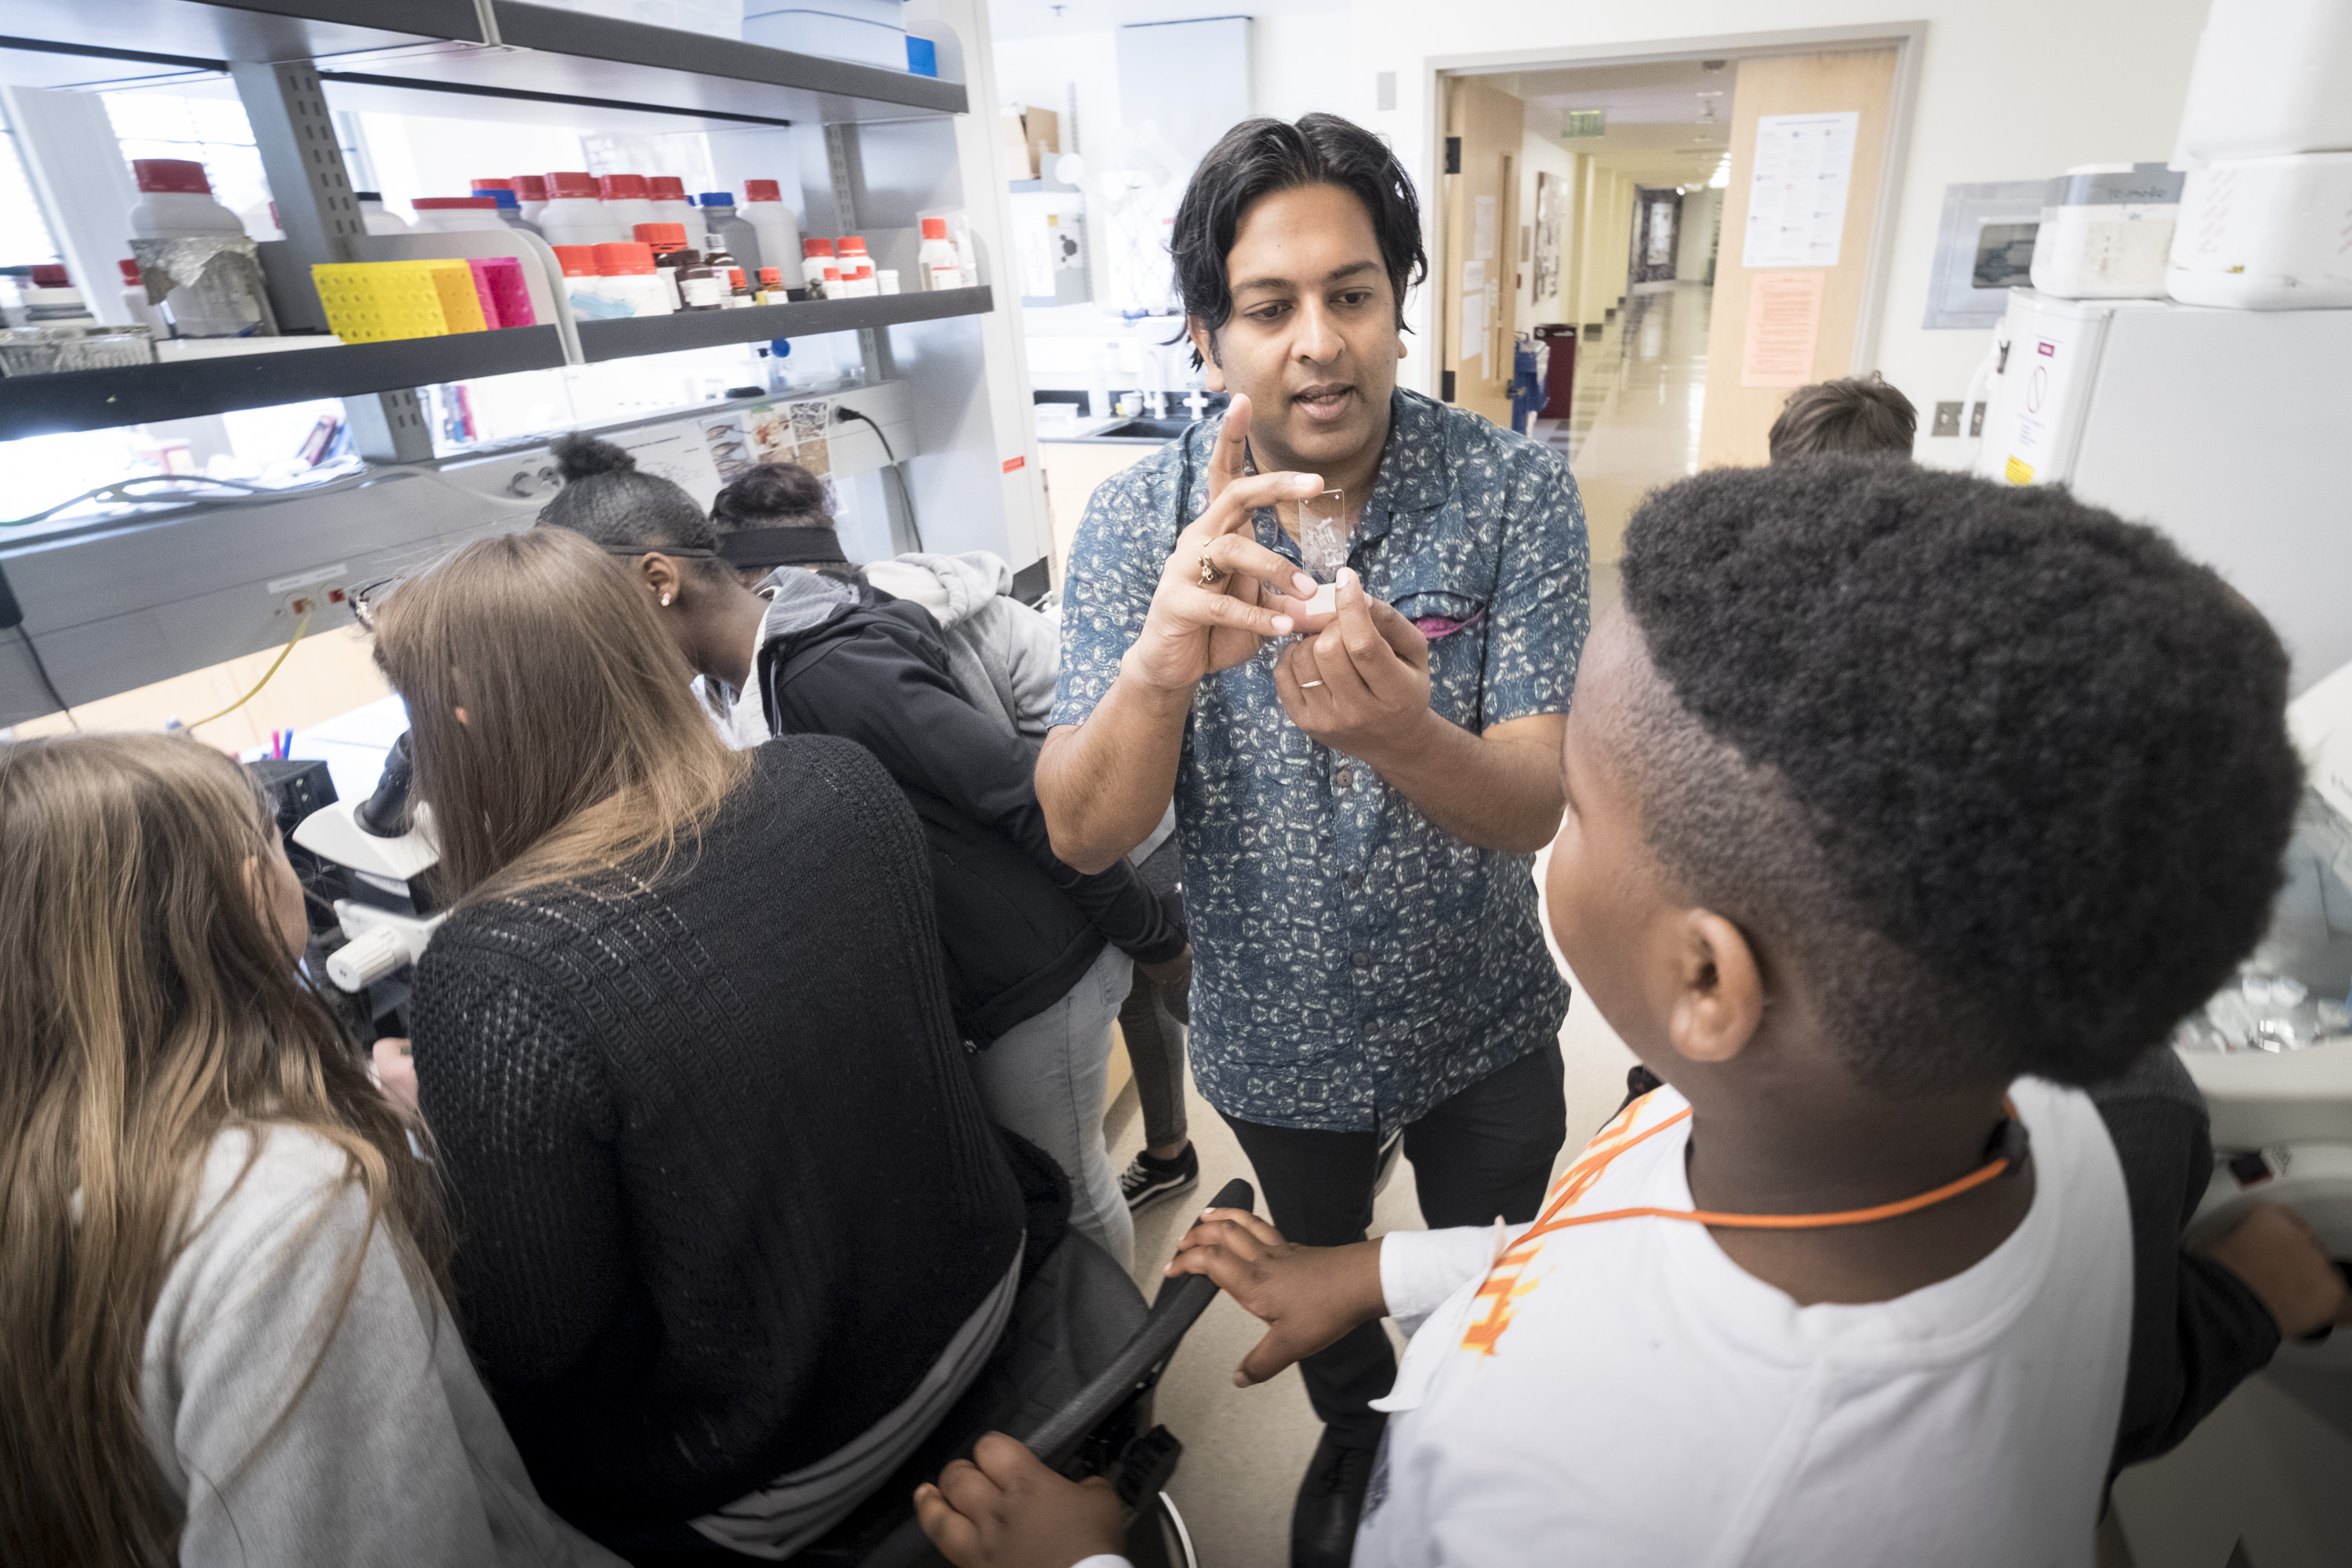
Prof. Steven Neshyba

All the components of this project have been established as sound pedagogy, but the combination hasn't been tested.

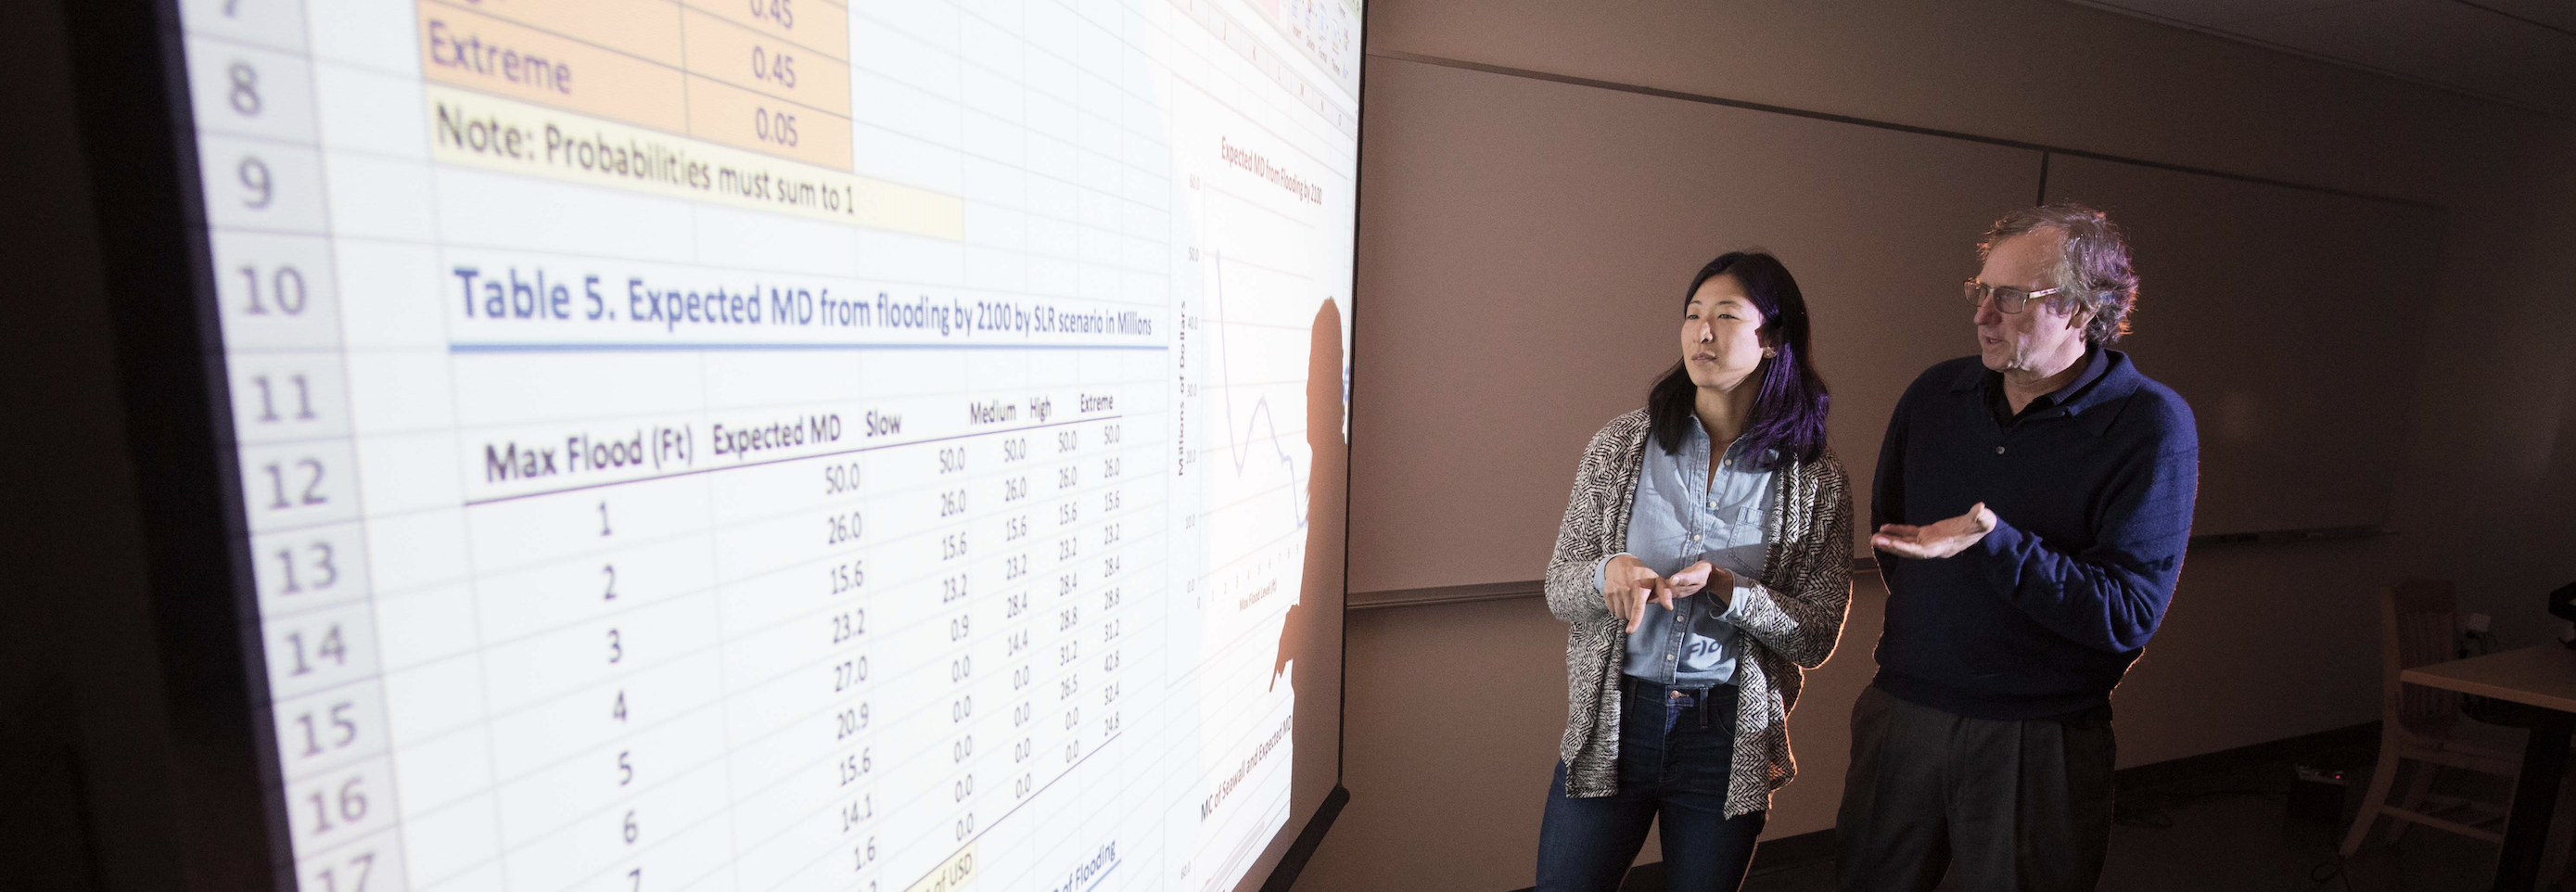
But it’s not just for science students. Lea points out that while scientists anticipate the impacts of climate change, economists think about policy planning. Students in a recent urban economics class looked at data on sea-level rise, based on polar ice melt data projections, to ascertain how many homes could be damaged by rising tides in Tacoma. That information is useful to urban planners, who can make better decisions if they know which parts of the city are projected to be impacted by increased flooding and other weather-related events.

Steven says that the interdisciplinary nature of polar research starts with the collection of data itself. He explains that, as with space travel, the high costs of polar missions mean that scientists are often collecting data for several projects in different fields of study simultaneously. He has seen this himself on research trips to the Arctic, as has his wife, Dr. Penny Rowe, a research scientist with NorthWest Research Associates who is named as the third principal investigator on the NSF grant and has been highly involved in the project’s development. She is currently doing fieldwork in Antarctica.

With the Polar CGI project, Steven and Lea wanted to bring the spirit of shared information to the classroom. “We began to think, ‘Let’s take polar data and insert it into all kinds of courses, into lots of different disciplines,’” Steven says. “A little something for chemistry, economics, physics.”

The NSF grant provides $300,000 to support a team of instructors to design, develop, and evaluate seven CGI modules over a period of two years. The instructors include a chemist (and Puget Sound alum) at Millikin University, a physicist at Edmonds Community College, a computer scientist at Willamette, and atmospheric scientists from the University of Washington and Washington State University. Puget Sound professor Amy Ryken joined the team as a senior curriculum development specialist. There was also support for two student researchers: Chemistry major Aedin Wright ’18 and economics major Max Coleman ’18 have been heavily involved.

The team set out to create curriculum modules that could be inserted into syllabi to enhance existing course objectives. These  looked different for every course. Last fall, Steven and Lea co-taught a course in which students learned to run a global climate model, then used that model to evaluate various global greenhouse-gas scenarios. At Willamette University, an image processing class used satellite images of the polar ice caps to teach students how to utilize advanced graphics techniques on digital images. 


Aedin Wright '18

We really wanted to focus on getting students to figure out how to ask questions. Doing real science at advanced levels is more creative and less rigid, and we wanted the questions to reflect that that’s how science actually happens.

Another vital component of the project is the “flipped classroom,” a teaching tool that is already widely utilized on campus. The practice reverses the traditional structure in which lectures are done in the classroom and problem-solving is done in the library or dorm room. Steven records his lectures and makes them available to students online—where they can be watched, paused, and revisited anytime. Class time is now spent working individually and in groups, with Steven there and available for questions.

“I’ve found that watching students solve problems right in front of me, and sharing suggestions or strategies in real time, is a more effective use of my skills,” he says. “It also helps with students who get it and have advanced questions.” This way, he’s also able to field any questions or issues that come up with the new Polar CGI component of his curriculum.

In order to explore the combined impacts of polar data, CGI, and flipped classrooms on student learning, Steven and Lea need to evaluate the project’s results. “All the components of this project have been established as sound pedagogy, but the combination hasn’t been tested,” Steven explains. “So we’re aiming to evaluate how this works: Do students learn differently in such an environment? Does the method attract students who may not otherwise have been attracted to the sciences?”

The team knew that they didn’t want to write an exam to simply test knowledge. That wasn’t the point, since these modules within classes are designed to get students to engage with the data, to critically analyze it—to think. What kind of evaluation tool could show that a chemistry, economics, or graphics student is actually engaging with the information unique to their class?

Aedin and Max brought a valuable student perspective to the evaluation process. “We really wanted to focus on getting students to figure out how to ask questions,” Aedin says. “Doing real science at advanced levels is more creative and less rigid, and we wanted the questions to reflect that that’s how science actually happens.”

To that end, the team came up with pre-assessment and post-assessment survey queries. In the pre-assessment query, students were asked to look at the polar data particular to the subject they were studying and ask—not answer—questions about it. Then they worked through the Polar CGI module created for their class. In the post-assessment query, students were required to answer the same prompts again, doing as scientists do, which is asking questions and forming hypotheses before and after grappling with data.

How does the team know if they’ve achieved their goal in getting students to think critically, like scientists? “We’re looking for greater complexity in their questions,” Lea says.

The first test run of the evaluation process was a success. “It looked like, over time, the students’ answers became more sophisticated,” Aedin says. This indicated that students were truly engaging with the information. Aedin called the method “really inclusive” since it gets students to ask their own questions rather than answer a professor’s.

Aedin plans to continue working on the design of this process as part of her senior thesis. “I’ll be evaluating the surveys and figuring out how to code the answers,” she says. “I’ll code as many as I get back and hope to be able to quantify the success of the modules.” The external evaluator for the project, Candiya Mann from the University of Washington, will also be auditing the assessment results.

The NSF grant will allow the team to continue developing the Polar CGI modules for two years. They hope to double the number of participating professors in the next academic year, so that they can try it out with a wider range of curricula. The students are certainly hungry for it. “Climate change is something we care about,” says Max, “since we are poised to feel the effects of it within our lifetimes.”