In this section

The Science Core Facility provides necessary equipment and expertise to help maintain active research labs, and facilitate publications in peer-reviewed journals. Below are some of the most recent publications that utilized instruments in the Core. 

University of Puget Sound student co-authors are in bold and faculty/post-doc/staff co-authors are italicized

Each entry below begins with an abbreviation of the instrument(s) featured in the paper, followed by the title of the published paper. 

Instrument Abbreviations

  • Confocal - Nikon D-Eclipse C1 Confocal Laser Scanning Microscope
  • Plate Reader - SpectraMax M2 Microplate Reader
  • qPCR - Bio-Rad CFX96 Real-Time PCR Detection System
  • SEM - Hitachi S3400N Variable Pressure Scanning Electron Microscope

Neshyba S.P., Lowen B., Benning M., Lawson A., Rowe P.M. (2013). Roughness metrics of prismatic facets of ice. Journal of Geophysical Research: Atmospheres 118(8). https://doi.org/10.1002/jgrd.50357

  • Features the use of: Hitachi S-3400N VP SEM
Pagarigan K.T., Bunn B.W., Goodchild J., Rahe T.K., Weis J.F., Saucedo L.J. (2013). Drosophila PRL-1 Is a Growth Inhibitor That Counteracts the Function of the Src Oncogene. PLOS ONE 8(4): e61084. https://doi.org/10.1371/journal.pone.0061084

  • Features the use of: Nikon D-Eclipse C1 Confocal Microscope.

Matsushita S.C., Tyagi A.P., Thornton G.M., Pires J.C., Madlung A. (2012). Allopolyploidization Lays the Foundation for Evolution of Distinct Populations: Evidence From Analysis of Synthetic Arabidopsis Allohexaploids. Genetics 191(2): 535-547.  https://doi.org/10.1534/genetics.112.139295

  • Features the use of: Nikon D-Eclipse C1 Confocal Microscope.

Pfalzgraff W., Neshyba S., Roeselova M. (2011). Comparative Molecular Dynamics Study of Vapor-Exposed Basal, Prismatic, and Pyramidal Surfaces of Ice. Journal of Physical Chemistry 115(23): 6184-6193. https://doi.org/10.1021/jp111359a

  • Features the use of: Hitachi S-3400N VP SEM
McCullough E., Wright K.M., Alvarez A., Clark C.P., Rickoll W.L.Madlung A. (2010) Photoperiod-dependent floral reversion in the natural allopolyploid Arabidopsis suecica. New Phytologist 186(1): 239-250.  https://doi: 10.1111/j.1469-8137.2009.03141.x

  • Features the use of: Nikon Microphot FX, Zeiss Transmission Electron Microscope EM902

Pfalzgraff W.C., Hulscher R.M., Neshyba S.P. (2010). Scanning electron microscopy and molecular dynamics of surfaces of growing and ablating hexagonal ice crystals. Atmospheric Chemistry and Physics 10: 2927-2935. https://doi.org/10.5194/acp-10-2927-2010

  • Features the use of: Hitachi S-3400N VP SEM
Publication Date: 16 June 2021

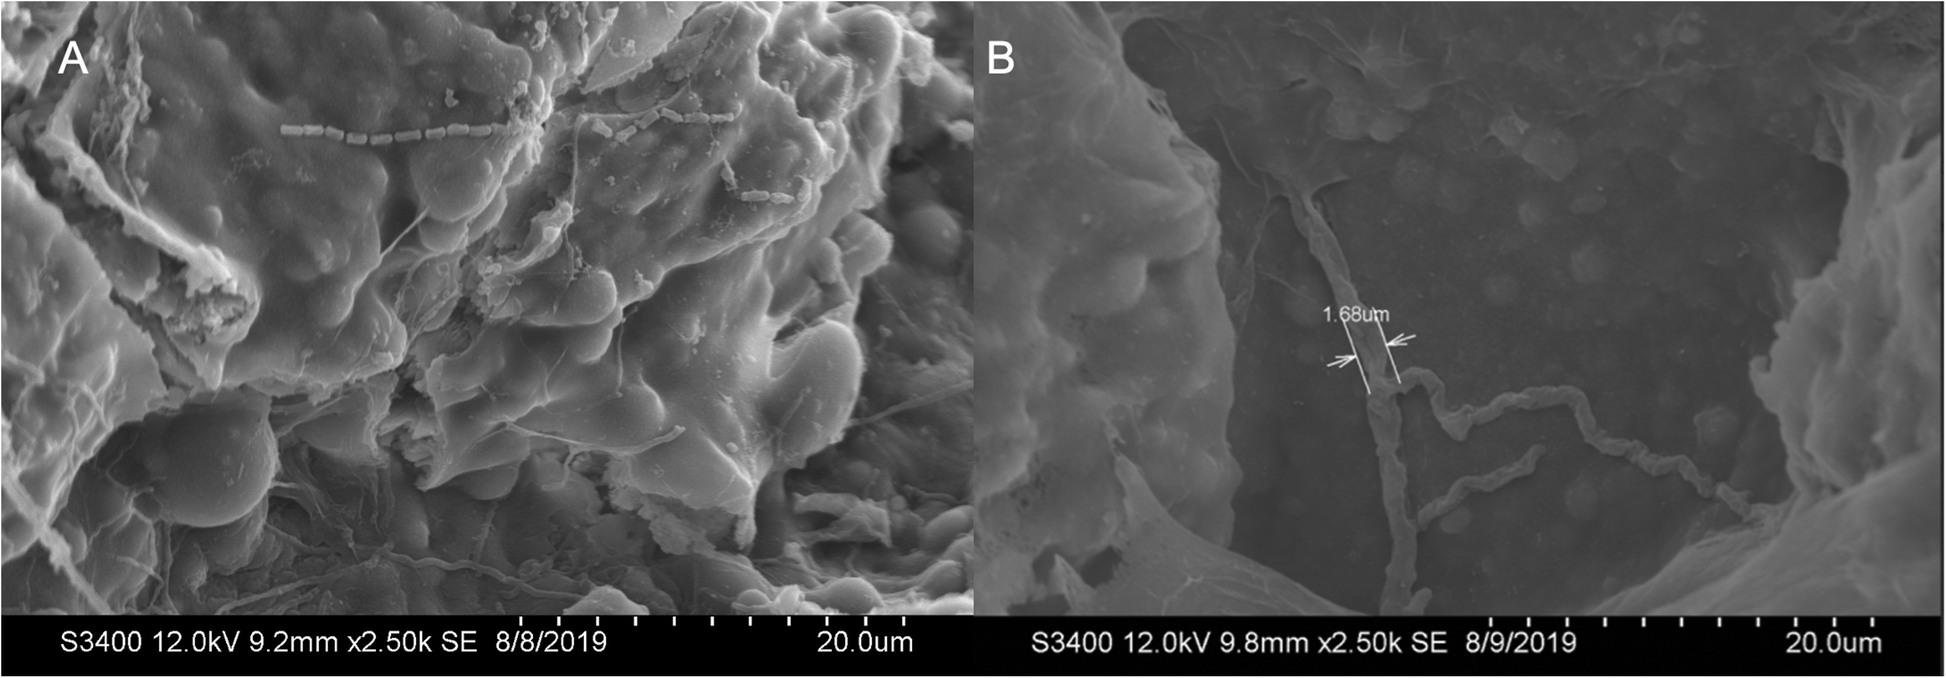
The striped plateau lizard lays their eggs in soil burrows, right at the start of the hot and wet monsoon season, and then they leave the nest site — providing no further parental care. How do the eggs survive their two month incubation period in the soil, surrounded by potential fungal pathogens? In this paper, coauthored with two undergraduate students, we show that maternal microbes are transferred from mom to eggshell during egg-laying, and that these beneficial bacteria provide antifungal protection to the eggs. Eggs with maternal microbes are better able to fend off attachment of pathogenic fungi, resulting in higher hatch success and better offspring quality.

Bunker, M.E., G. Elliott, H. Heyer-Gray, M.O. Martin, A.E. Arnold, and S.L. Weiss. 2021. Vertically transmitted microbiome protects eggs from fungal infection and egg failure. Animal Microbiome 3:43.

Fig. 1

Figure 1. A Scanning electron microscope images of rod-shaped bacteria and fungal hyphae on S. virgatus eggshells. B Fungal hyphae cover the eggshell in a branched structure that spreads across the surface. Both images taken at 2.5 k magnification.

Read More

Publication Date: 27 February 2019

Phytochromes comprise a small family of photoreceptors with which plants gather environmental information that they use to make developmental decisions, from germination to photomorphogenesis to fruit development. Most phytochromes are activated by red light and de-activated by far-red light, but phytochrome A (phyA) is responsive to both and plays an important role during the well-studied transition of seedlings from dark to light growth. We profiled proteomic and transcriptomic seedling responses in tomato during the transition from dark to light growth and found that phyA participates in the regulation of carbon flux through major primary metabolic pathways, such as glycolysis, beta-oxidation, and the tricarboxylic acid (TCA) cycle. 

Carlson K.D., Bhogale S., Anderson D., Tomanek L., Madlung A. (2019). Phytochrome A Regulates Carbon Flux in Dark Grown Tomato Seedlings. Frontiers in Plant Science 10:152. DOI: 10.3389/fpls.2019.00152

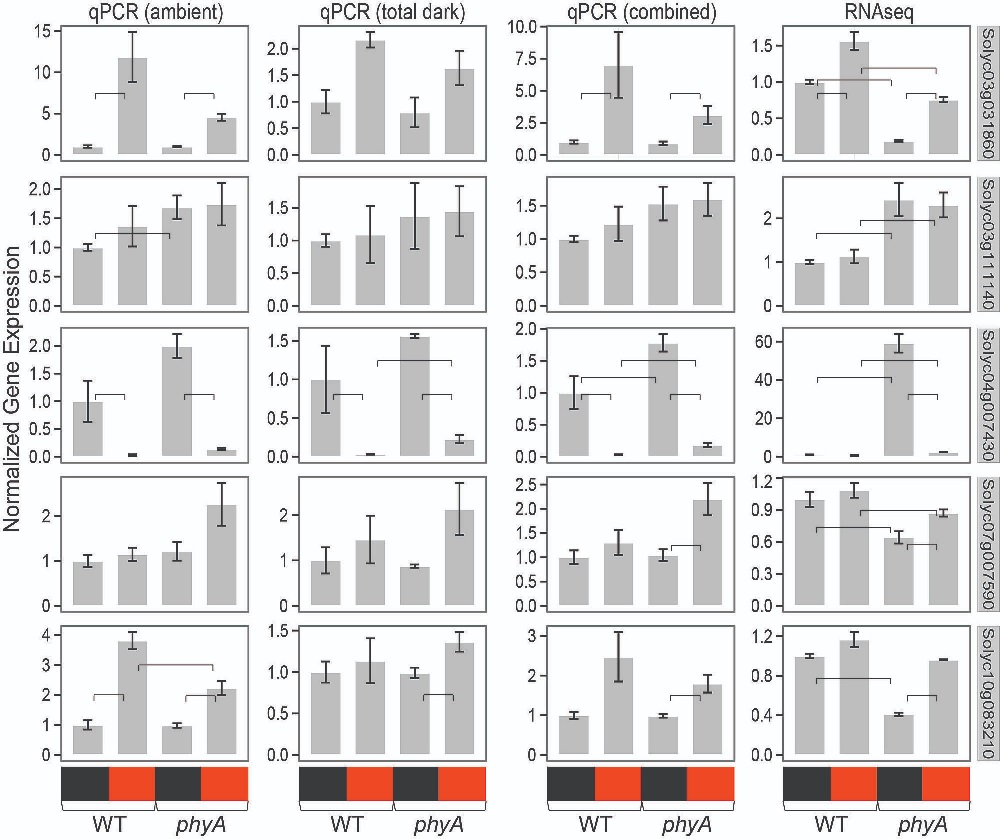
QPCR validation of expression patterns of five genes from RNAseq analysis. Normalized gene expression of five genes from two qPCR experiments (first three columns) and RNAseq experiment (last column) is shown.

FIGURE S2. QPCR validation of expression patterns of five genes from RNAseq analysis. Normalized gene expression of five genes from two qPCR experiments (first three columns) and RNAseq experiment (last column) is shown. QPCR experiments were performed to replicate RNAseq experiment, one with seed sterilization in ambient lab light like done for RNAseq (ambient) and the other with seed sterilization in dark with green safe light (total dark) as a control. QPCR expression was calculated with the 2-ΔΔCt method; RNAseq expression values are from DEseq normalized read counts. In all cases, expression was normalized to expression of WT grown in the dark (WT-D = 1). Error bars show standard error of the mean. For qPCR data, t-tests were performed to compare expression in WT-D to WT grown in 60 min R (WT-R), phyA mutants grown in the dark (phyA-D) to phyA mutants grown in 60 min of R (phyA-R), WT-D to phyA-D, and WT-R to phyA-R. Brackets indicate p ≤ 0.05 in that sample comparison. For RNAseq data, brackets indicate significant differential expression found in RNAseq analysis in that sample comparison. Note that while the expression patterns are similar between experiments, the magnitude of expression differs in some comparisons and the y-axis was adjusted accordingly.

Read More

Publication Date: February 2019

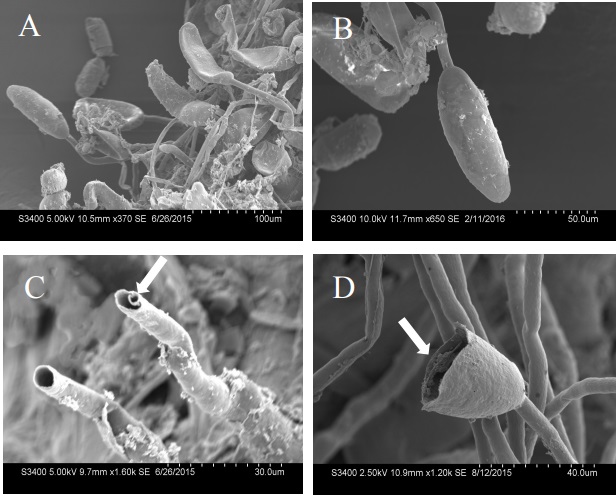
The objective of this study was to identify the parasite causing the formation of root hair galls on eelgrass (Zostera marina) in Puget Sound, WA. Microscopic and molecular analyses revealed that a novel protist formed plasmodia that developed into sporangia in root hair tip galls and released biflagellate swimming zoospores. Future studies are needed to establish the taxonomy of the parasite, its effects on Z. marina, and the factors that determine its distribution and abundance.

Elliott J.K., Simpson H., Teesdale A., Replogle A., Elliott M., Coats K., Chastagner G. (2019). A Novel Phagomyxid Parasite Produces Sporangia in Root Hair Galls of Eelgrass (Zostera marina). Protist 170(1): 64-81. 

Scanning electron microscope images of many root hair tip galls

Figure 4. Scanning electron microscope images of many root hair tip galls (A), single root hair tip gall (B), broken root hairs (C), broken root hair tip gall showing double-wall (D).

Read More

Publication Date: 10 April 2019

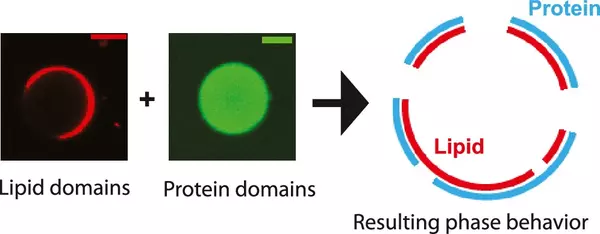
Cell plasma membranes are a heterogeneous mixture of lipids and membrane proteins. The importance of heterogeneous lipid domains (also called lipid rafts) as a molecular sorting platform has been implicated in many physiological processes. Cell plasma membranes that are detached from the cytoskeletal structure spontaneously phase separate into distinct domains at equilibrium, which show their inherent demixing properties. In this paper, we used in vitro reconstitution and fluorescence imaging to systematically quantify the phase behavior that arises when proteins with inherent phase separation properties interact with raft mixture lipid membranes. Our observations and simulations show both that the proteins may enhance lipid phase separation and that this is a general property of phase-separating protein systems with a diverse number of components involved.

Lee I.Imanaka M.Y.Modahl E.H., Torres-Ocampo A.P. (2019). Lipid Raft Phase Modulation by Membrane-Anchored Proteins with Inherent Phase Separation Properties. ACS Omega 4(4): 6551-6559.

Reconstitution of interaction between lipid and protein domains.


Figure 1. Reconstitution of interaction between lipid and protein domains. The upper left panel shows a typical confocal fluorescence image of a phase-separated ternary mixture GUV. The signal was from TR-DHPE lipid. The upper right panel shows a typical confocal fluorescence image of a solution phase-separated protein droplet domain from a two-component system (SH3 × 4 and PRM × 4). The signal was from SH3 × 4-Atto488. Scale bars are 5 μm. The lower schematic is a possible outcome of coexistence of both on the lipid bilayer.

Read More

Publication Date: 22 February 2017

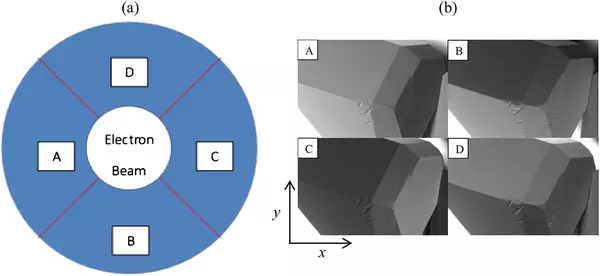
The authors have found a way to extract three-dimensional information about the surfaces of tiny ice crystals grown under a high-powered scanning electron microscope. They found that these surfaces contain some unexpected features, with long, deep valleys in some instances, and rounded hills in others. The authors believe that these features may help understand how rough ice surfaces in real cirrus clouds affect Earth's climate.

Butterfield N., Rowe P.M., Stewart E., Roesel D., Neshyba S. (2017). Quantitative three‐dimensional ice roughness from scanning electron microscopy. Journal of Geophysical Research: Atmospheres 122(5): 3023-3041.

Schematic of an SEM backscatter detector assembly and Near-simultaneous images of an ice crystal as recorded by each detector.

Figure 1.

(a) Schematic of an SEM backscatter detector assembly. The electron beam passes through the center of the disk, and each detector occupies the quadrant indicated. (b) Near-simultaneous images of an ice crystal as recorded by each detector.

Read More

Publication Date: 17 July 2017

The ubiquitin 26S proteasome system (UPS) selectively degrades cellular proteins, which results in physiological changes to eukaryotic cells. F-box proteins are substrate adaptors within the UPS and are responsible for the diversity of potential protein targets. Plant genomes are enriched in F-box genes, but the vast majority of these have unknown roles. This work investigated the Arabidopsis F-box gene F-BOX STRESS INDUCED 1 (FBS1) for its effects on gene expression in order elucidate its previously unknown biological function.

Gonzalez L.E., Keller K., Chan K.X., Gessel M.Thines B.C. (2017). Transcriptome analysis uncovers Arabidopsis F-BOX STRESS INDUCED 1 as a regulator of jasmonic acid and abscisic acid stress gene expression. BMC Genomics 18(533).

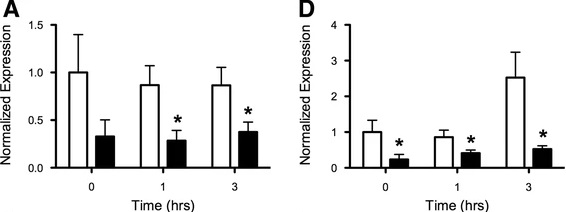
qPCR analysis of differentially expressed JA biosynthetic genes.

Part of Figure 4: qPCR analysis of differentially expressed JA biosynthetic genes.

Seven day-old Arabidopsis wild type (white bars) and fbs1–1 (black bars) seedlings were either untreated (time 0) or treated for up to three hours with 10 °C chilling temperature. Transcript abundances for a LOX2 and d AOC3 are shown. All genes have statistically significant differences between the genotypes for at least one time point (two-way ANOVA; asterisks indicate statistical significance p < 0.05 between genotypes using Bonferroni post-tests). Shown are the average relative quantities (NRQs) (± SEM) normalized to IPP2 and PP2A within the same sample and to the wild type expression level for that gene in untreated seedlings, which was set to 1, from three independent experimental replicates.

Read More

Publication Date: 19 February 2016

Allopolyploids are organisms possessing more than two complete sets of chromosomes from two or more species and are frequently more vigorous than their progenitors. To address the question why allopolyploids display hybrid vigor, we compared the natural allopolyploid Arabidopsis suecica to its progenitor species Arabidopsis thaliana and Arabidopsis arenosa. Our data suggest that the magnitude of heterosis in A. suecica is environmentally regulated, arises from more efficient photosynthesis, and, under specific conditions, leads to greater starch accumulation than in its progenitor species.

Solhaug E.M.Ihinger J.Jost M.Gamboa V.Marchant B., Doerge R.W., Tyagi A., Replogle A.Madlung A. (2016). Environmental regulation of heterosis in allopolyploid Arabidopsis suecica. Plant Physiology 170(4): 2251-2263.

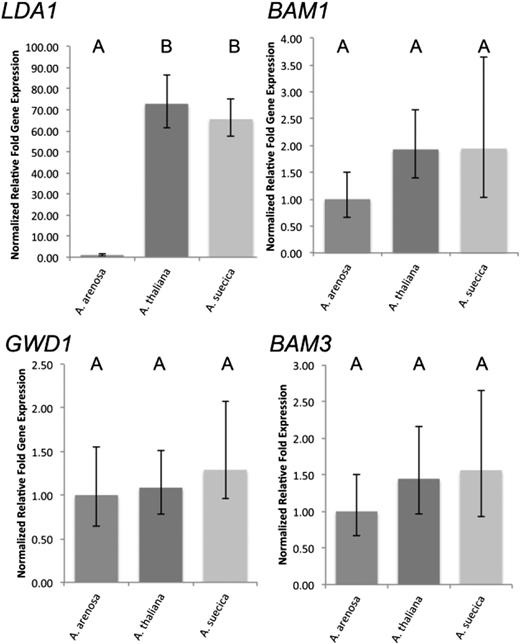
Major starch metabolism genes are expressed at the high progenitor level or are similar in all species.

Figure 6. Major starch metabolism genes are expressed at the high progenitor level or are similar in all species. Plants were grown under light intensities of ∼200 µmol m−2 s−1 light until the night before the experiment. After 12 h of darkness, plants were exposed to high light conditions (∼750 µmol m−2 s−1) and harvested after 5 h of irradiation (ZT = 5 h). qPCR was performed for eight to nine biological replicates and averages are shown. Each biological replicate contained RNA from exactly one individual, and three technical PCR replicate reactions were performed per biological replicate. Data were analyzed using qBase+ software. Error bars represent 95% confidence intervals. Species that are not connected by the same letter are statistically significantly different from each other. Expression levels were normalized against expression in A. arenosa, which was set to 1.


Read More

Publication Date: 25 May 2015

Angiosperm flowers are usually determinate structures that may produce seeds. In some species, flowers can revert from committed flower development back to an earlier developmental phase in a process called floral reversion. We have used light and electron microscopy to further describe this phenomenon.

Asbe A.Matsushita S.C.Gordon S.G., Kirkpatrick H.E., Madlung A. 2015. Floral reversion in Arabidopsis suecica is correlated with the onset of flowering and meristem transitioning. PLOS ONE 10(5): e0127987.


Fig 2. Floral reversion in Asuecica originates from the replum.

A: The top valve of a reverting carpel was removed and the tissue imaged using environmental SEM. Multiple new floral stems (light green) originate out of the replum (dark green), which is connected to the gynophore (bottom right). The original stigma of the reverting flower is colored yellow for orientation. B: The same reverting carpel as in A. In this view the new inflorescence was unfolded and placed above its remaining carpel valve. Gynophore and replum are fused (dark green), and several new inflorescence stems branch off of the replum (light green). Stigma is colored in yellow as above. Colors are false colors. Size bar in B is the same as for A = 25 mm.


Read More